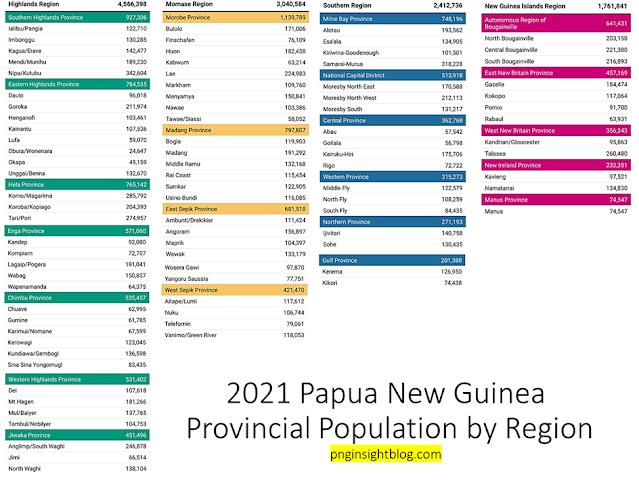
The provided text contains information about the Population Estimates 2021 for Papua New Guinea (PNG) produced by the National Statistical Office (NSO). It's important to note that the Population Estimates 2021 for PNG were generated through the use of satellite images and surveys.
The data is crucial for decision-making and planning at various levels of government and institutions, contributing to the country's development goals. The estimate's accuracy is acknowledged, but it is also recognised that a complete census remains the most reliable data source.
PNG's Total Population in 2021: 11,781,559
- Males: 6,142,585
- Females: 5,638,974
This estimate is higher than the predicted population figures from the CIA World Factbook (2022, Wikipedia.org) we used here.
Population Key Indicators (2021 Estimates)
Each of the figures in the Population Key Indicators provides valuable information about the age and gender distribution of the population in Papua New Guinea in 2021.
Let's explain each of these indicators:
1. Sex Ratio (Male to Female): 108.9
This figure represents the number of males for every 100 females in the population. In this case, the sex ratio is 108.9, indicating that there are approximately 108.9 males for every 100 females in the country.
A sex ratio greater than 100 indicates that there are more males than females in the population.
2. Percentage of Working Age Population (15 to 64 years old): 61.6%
This percentage represents the proportion of the population that falls within the working-age group, which is typically considered to be between 15 and 64 years old.
In this case, 61.6% of the population is within this age range and is likely to be part of the labour force and actively contributing to the economy.
3. Percentage of Older Population (65 years old and over): 2.7%
This percentage represents the proportion of the population that is 65 years old and older. It indicates the share of elderly individuals in the total population.
A higher percentage suggests that the population is ageing, which can have implications for healthcare, social services, and pension systems.
4. Percentage of Youth (15 to 24 years old): 21.6%
This percentage represents the proportion of the population that falls within the youth age group, typically considered to be between 15 and 24 years old.
This demographic segment includes young adults who are transitioning from adolescence to adulthood and may be pursuing education or entering the workforce.
5. Total Dependency Ratio (0-14 + 65 years old) / 15-64 years old: 62.4%
The total dependency ratio is a measure of the economic burden on the working-age population. It is calculated by dividing the combined number of individuals aged 0 to 14 (children) and 65 years and over (elderly) by the number of individuals aged 15 to 64 (working age).
In this case, for every 100 working-age individuals, there are 62.4 dependents who are either too young or too old to participate in the labour force.
6. Children Dependency Ratio (0-14 / 15-64 years old): 58.1%
The children dependency ratio specifically measures the burden on the working-age population due to children (aged 0 to 14). It is calculated by dividing the number of children by the number of working-age individuals.
A higher ratio indicates a larger proportion of children dependent on the working-age population.
7. Old-Age Dependency Ratio (65 years old and over / 15-64 years old): 4.3%
The old-age dependency ratio measures the burden on the working-age population due to elderly individuals (aged 65 and over). It is calculated by dividing the number of elderly individuals by the number of working-age individuals.
A higher ratio indicates a larger proportion of elderly dependents on the working-age population.
8. Median Age (Both Sexes): 21.2
Median age represents the midpoint of the age distribution, where half of the population is older than the median age, and half is younger.
In this case, the median age for both sexes is 21.2 years, suggesting a relatively young population.
9. Median Age (Male): 20.8
The median age specifically for males, which is 20.8 years. This indicates that the midpoint of the male age distribution is 20.8 years.
10. Median Age (Female): 21.7
The median age specifically for females, which is 21.7 years. This indicates that the midpoint of the female age distribution is 21.7 years.
11. Percentage of Population Aged 18 and Over: 57.2%
This percentage represents the proportion of the population that is 18 years old and older. It indicates the share of adults in the total population who are eligible to participate in various legal and social activities.
12. Percentage of Women of Reproductive Age (15 to 49 years old): 55.3%
This percentage represents the proportion of women in the population who are within the reproductive age range of 15 to 49 years old.
This demographic segment is significant as it relates to issues concerning family planning, maternal health, and childbirth.
The population key indicators are essential for understanding the demographic composition of Papua New Guinea's population and can assist policymakers and planners in making informed decisions about various aspects of development, including healthcare, education, and social services.
How the Estimate is Calculated
The estimate is based on a series of different datasets and methods. The NSO uses recent, reliable population data collection exercises such as the Urban Structural Listing and Household Survey for the Long Lasting Insecticidal Net Distribution by Rotarians Against Malaria.
Geographic and administrative characteristics, such as night-time lights, distance to health providers, and slope, are measured using aerial images collected from satellites.
The relationship between population size and these characteristics is used to estimate the population in areas with limited data.
Accuracy of the Estimate
The Population Estimate has a 3% margin of error at the national level. However, it is emphasised that the estimate does not replace a National Population and Housing Census, which remains the most reliable source of information, providing not only population counts but also socio-demographic and economic characteristics at the lowest level of geographic subdivision of the country.


No comments:
Post a Comment